
GBP/USD Breaks Out of Symmetrical Triangle as 2026 Outlook Turns More Balanced
- Alex

- Jan 5
- 1 min read
GBP/USD staged a strong recovery in 2025, rallying from the 15-month low at 1.21 to a four-year high of 1.3790 by July 1, before moving into consolidation through the summer. The pair weakened between September and November, but regained ground into year-end. Looking ahead to 2026, the outlook appears more balanced, with growing uncertainty around how much further the US dollar can weaken, potentially limiting GBP/USD’s upside. For a deeper view on the macro drivers shaping the pair in 2026, refer to the fundamental outlook.
GBP/USD technical outlook
GBP/USD has broken higher from a symmetrical triangle formation, reaching a multi-year high at 1.3790 before pulling back to test trendline support near 1.30. The successful hold above this level allowed the pair to recover and stabilise.
Price remains above both the 50-day and 200-day moving averages, while RSI holds above the 50 level. This technical structure supports a continuation of the recovery, with a retest of 1.3790 in focus.
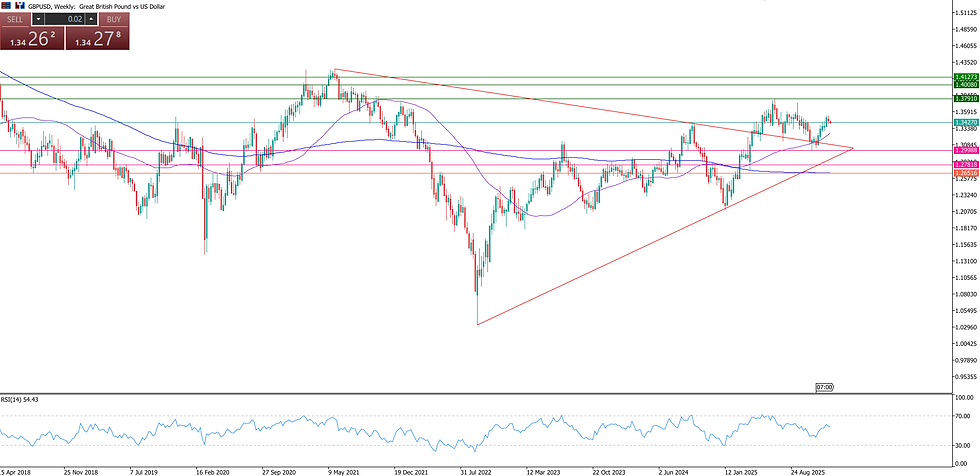
A sustained break above 1.3790 would confirm a higher high and open the door toward the 1.40 psychological level, followed by 1.4250, the 2021 peak.
On the downside, sellers would need a decisive break below 1.30 to shift momentum lower. This would expose 1.2780, aligned with rising trendline support. A further move below this level would bring the 200-day SMA near 1.2650 into view, ahead of the January low at 1.21.


Comments